Global Automobile Data
Production Volumes by Country
Production Volumes by Country (2009-2011)
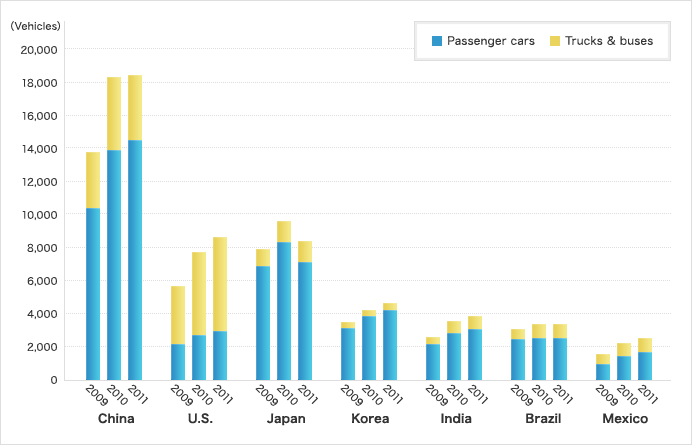
(Vehicles)
China |
U.S. |
Japan |
Korea |
India |
Brazil |
Mexico |
||
|---|---|---|---|---|---|---|---|---|
2009 |
||||||||
Total |
13,790,994 |
5,709,431 |
7,934,057 |
3,512,926 |
2,636,643 |
3,075,441 |
1,564,169 |
|
Passenger cars |
10,383,831 |
2,195,588 |
6,862,161 |
3,158,417 |
2,170,322 |
2,487,881 |
1,009,914 |
|
Trucks & buses |
3,407,163 |
3,513,843 |
1,071,896 |
354,509 |
466,321 |
587,560 |
554,255 |
|
2010 |
||||||||
Total |
18,264,761 |
7,743,093 |
9,628,920 |
4,271,741 |
3,546,797 |
3,381,728 |
2,260,774 |
|
Passenger cars |
13,897,083 |
2,731,105 |
8,310,362 |
3,866,206 |
2,822,431 |
2,584,690 |
1,468,967 |
|
Trucks & buses |
4,367,678 |
5,011,988 |
1,318,558 |
405,535 |
724,366 |
797,038 |
791,807 |
|
2011 |
||||||||
Total |
184,25,541 |
8,655,003 |
8,398,705 |
4,657,094 |
3,925,305 |
3,406,150 |
2,557,550 |
|
Passenger cars |
14,506,768 |
2,976,397 |
7,158,525 |
4,221,617 |
3,038,492 |
2,534,534 |
1,689,166 |
|
Trucks & buses |
3,918,773 |
5,678,606 |
1,240,180 |
435,477 |
886,813 |
871,616 |
868,384 |
|
Source: June 2012 issue of Automobile Statistics Monthly, Japan Automobile Manufacturers Association, Inc.
- Note:
- In descending order of 2011 production volumes