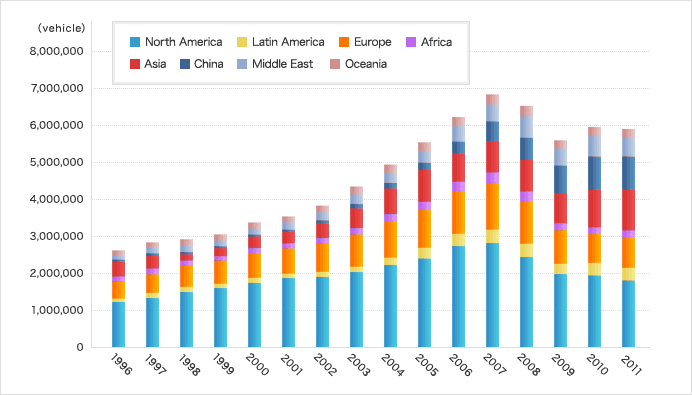
Sales Volume
Sales Volume Overseas
Sales Overseas by Region

Unit=thousand vehicles
|
Year
|
North America
|
Latin America
|
Europe
|
Africa
|
Asia
|
China
|
Middle East
|
Oceania
|
Total
|
|---|---|---|---|---|---|---|---|---|---|
|
1996
|
1233.3
|
100.4
|
438.8
|
135.5
|
431.5
|
23.8
|
114.4
|
144.2
|
2621.8
|
|
1997
|
1336.4
|
135.4
|
501.8
|
143.6
|
379.4
|
46.3
|
146.7
|
148.2
|
2837.6
|
|
1998
|
1489.4
|
151.6
|
560.5
|
129.7
|
201.2
|
38.9
|
182.3
|
176.5
|
2930.0
|
|
1999
|
1605.3
|
125.9
|
606.8
|
123.2
|
249.3
|
14.3
|
161.4
|
171.8
|
3058.1
|
|
2000
|
1742.8
|
129.1
|
671.9
|
121.8
|
348.2
|
23.5
|
168.7
|
176.7
|
3382.6
|
|
2001
|
1869.0
|
132.0
|
672.3
|
126.5
|
348.3
|
32.0
|
204.3
|
162.2
|
3546.7
|
|
2002
|
1908.9
|
128.8
|
764.8
|
139.8
|
431.1
|
62.3
|
220.3
|
182.2
|
3838.3
|
|
2003
|
2031.3
|
162.1
|
851.5
|
160.6
|
575.1
|
107.3
|
251.4
|
215.1
|
4354.5
|
|
2004
|
2230.3
|
214.9
|
946.9
|
206.7
|
718.9
|
127.4
|
270.9
|
232.8
|
4948.8
|
|
2005
|
2436.1
|
270.5
|
995.2
|
227.2
|
868.6
|
194.3
|
325.3
|
236.9
|
5554.1
|
|
2006
|
2738.3
|
339.4
|
1124.1
|
265.7
|
788.1
|
318.6
|
404.8
|
250.3
|
6229.3
|
|
2007
|
2822.2
|
379.4
|
1238.6
|
313.5
|
818.2
|
511.4
|
482.7
|
275.9
|
6841.9
|
|
2008
|
2441.8
|
370.2
|
1119.5
|
288.1
|
840.4
|
598.2
|
590.1
|
277.7
|
6526.1
|
|
2009
|
1975.4
|
293.6
|
886.0
|
201.4
|
817.8
|
716.1
|
482.5
|
231.2
|
5604.0
|
|
2010
|
1935.5
|
342.1
|
785.8
|
198.0
|
1038.8
|
857.0
|
554.6
|
249.7
|
5961.6
|
|
2011
|
1806.9
|
333.5
|
801.9
|
211.9
|
1103.0
|
895.2
|
527.5
|
215.9
|
5895.9
|
Source: TOYOTA IN THE WORLD
- *
- Regional categories are as defined by the Japan Automobile Manufacturers Association, Inc. Asia data excludes China, which is calculated separately.
- *
- Units include both Toyota and Lexus sales.
- *
- Decimals are rounded. Not all regional figures add up to their totals.


